Model-based Geostatistics for Global Public Health
From Methodology Development to Policy Applications
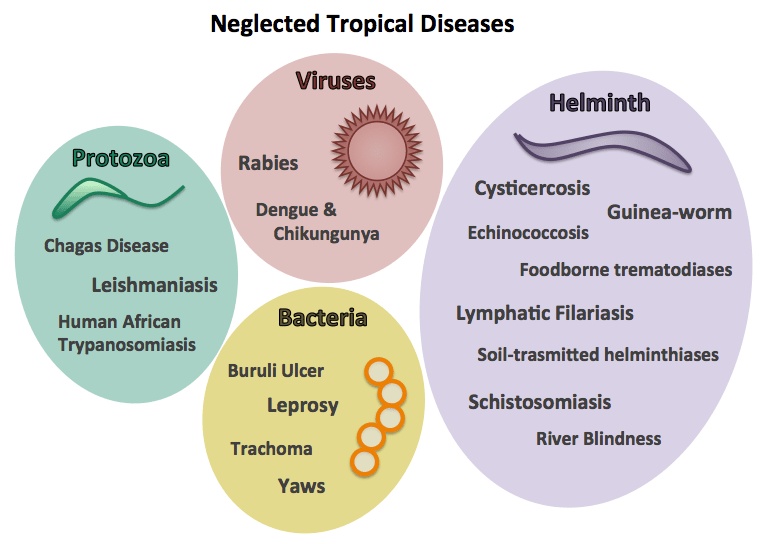
Neglected tropical diseases
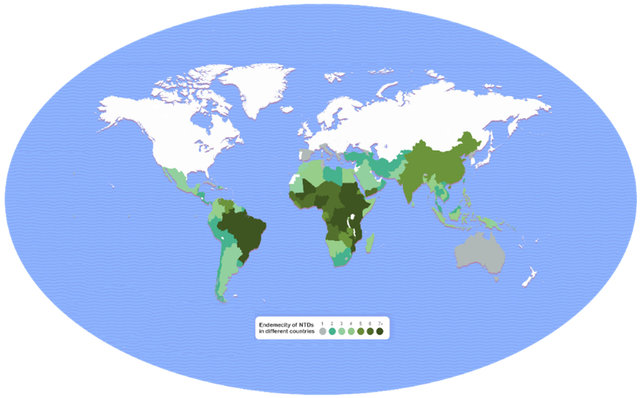
NTD endemic areas
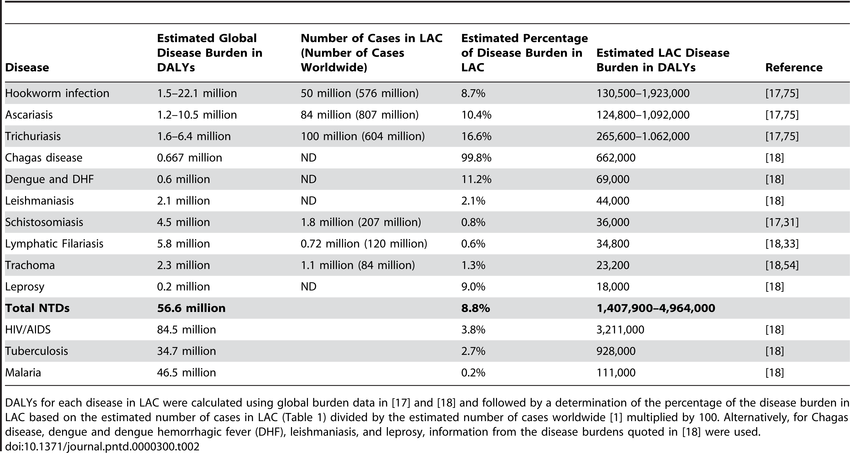
The impact of NTDs
NTDs Risk Factors
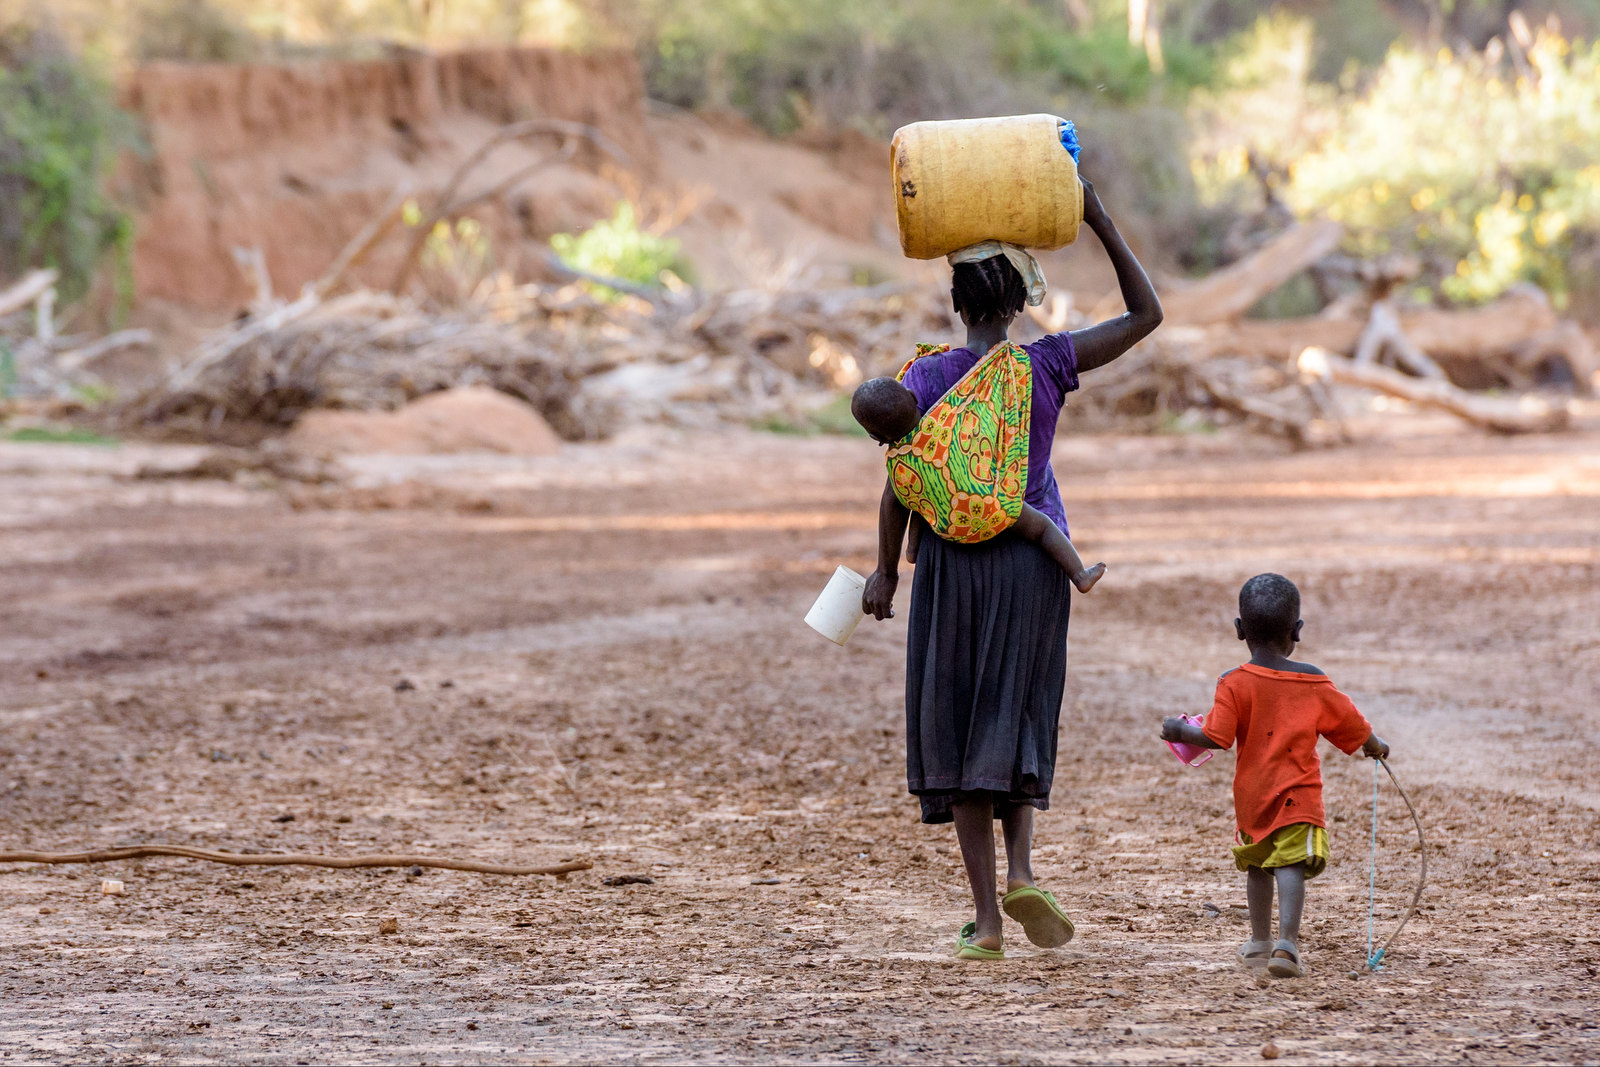
Common risk factors:
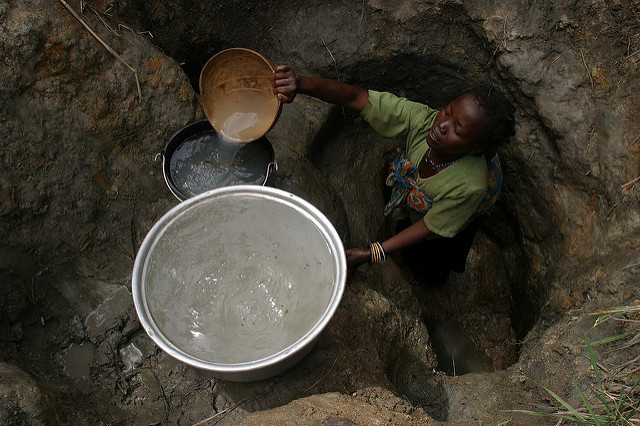
- Poor sanitation and lack of clean water
- Limited healthcare access
- Poverty and overcrowding
- Exposure to disease vectors (e.g., mosquitoes, flies)
- Lack of education and awareness
From the mining industry to public health


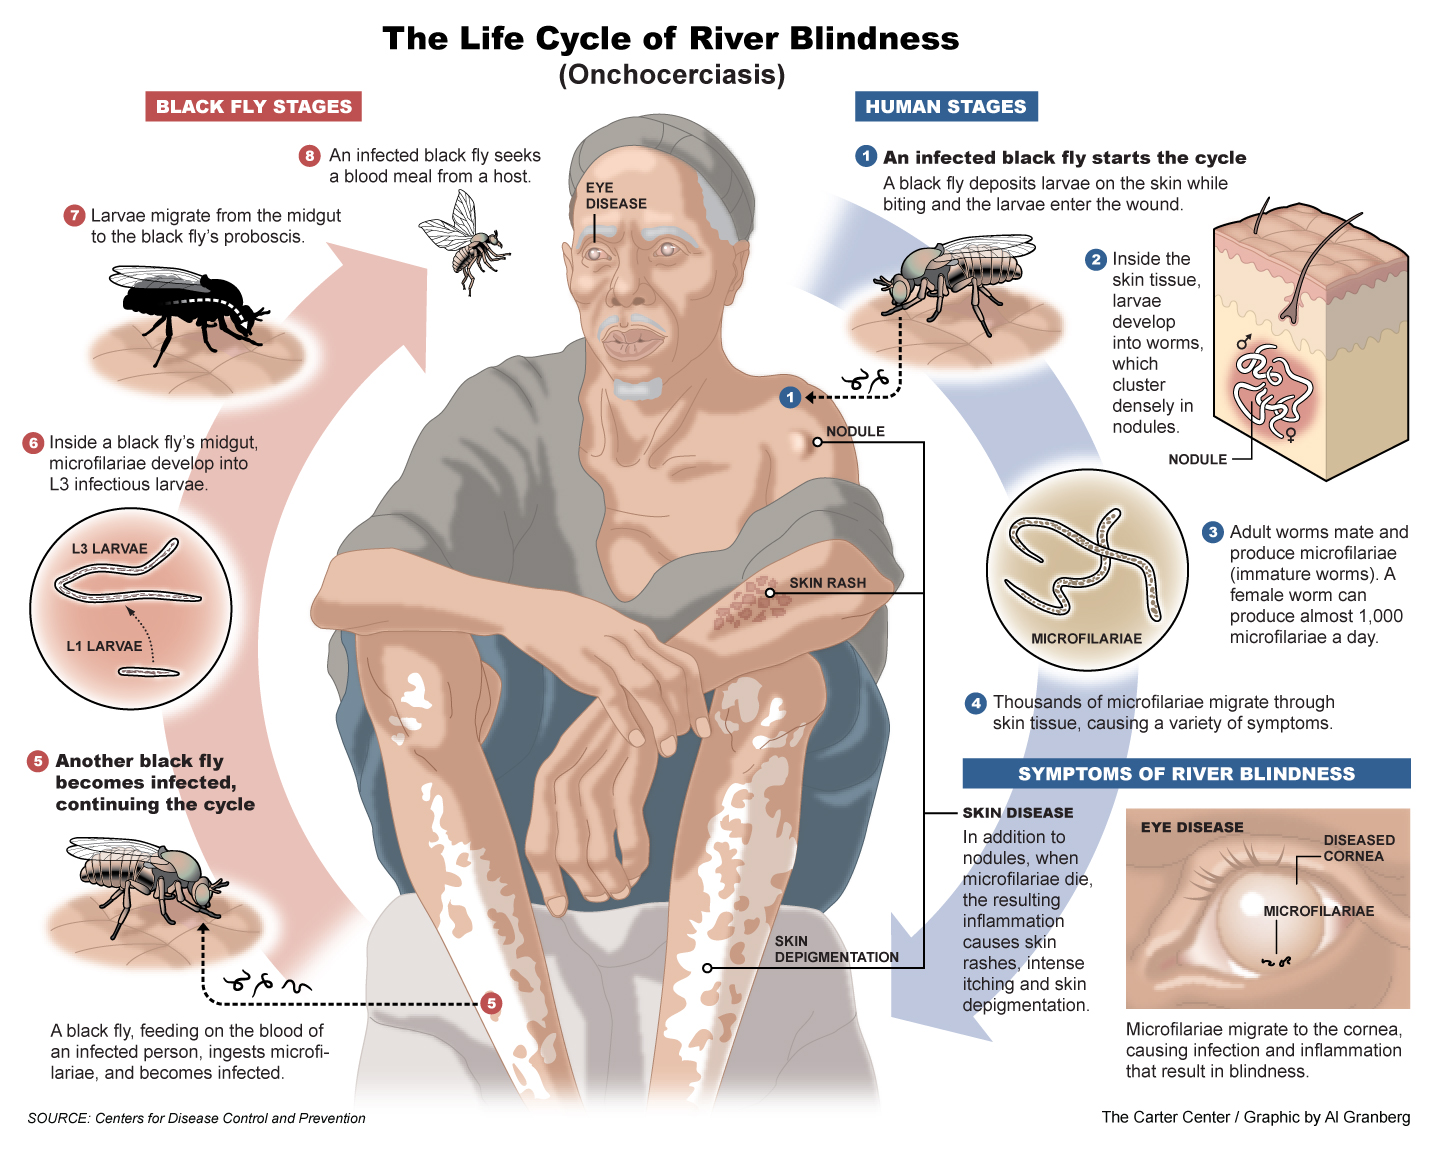
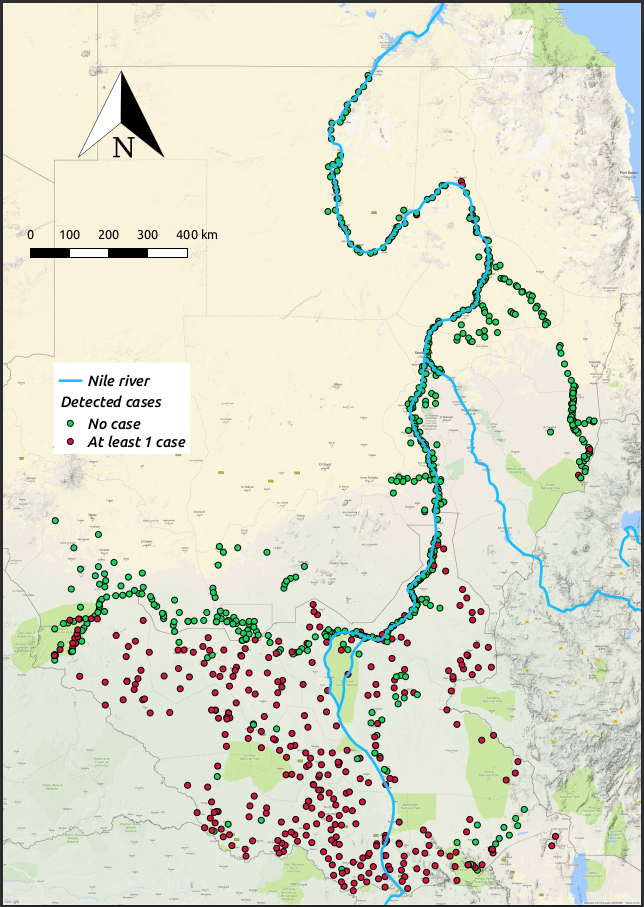
Riverblindness
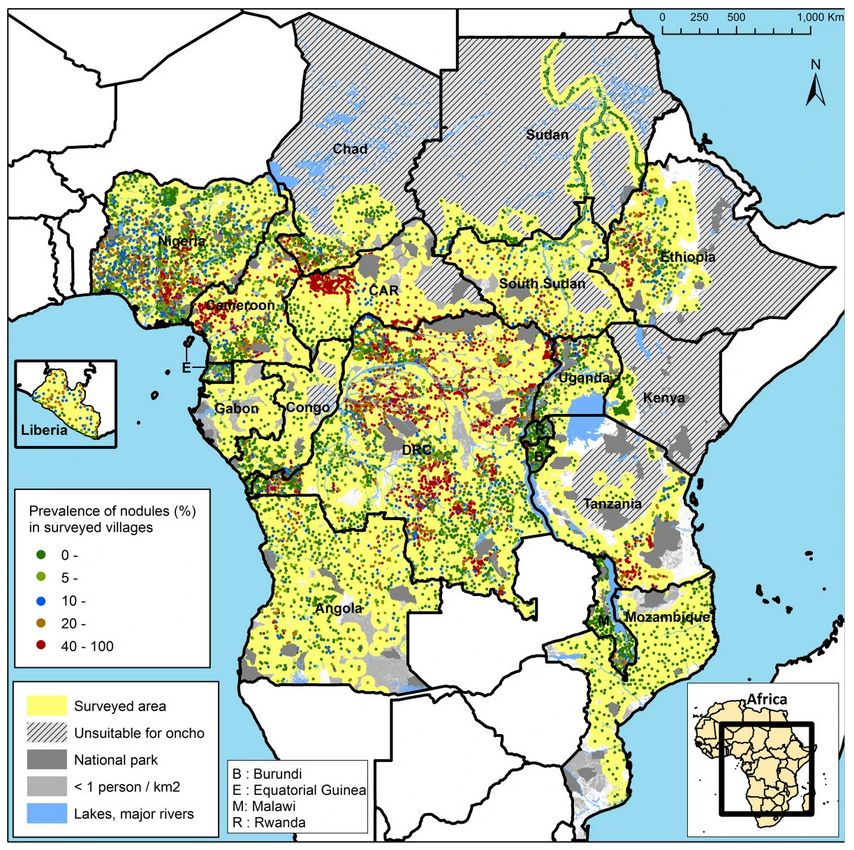
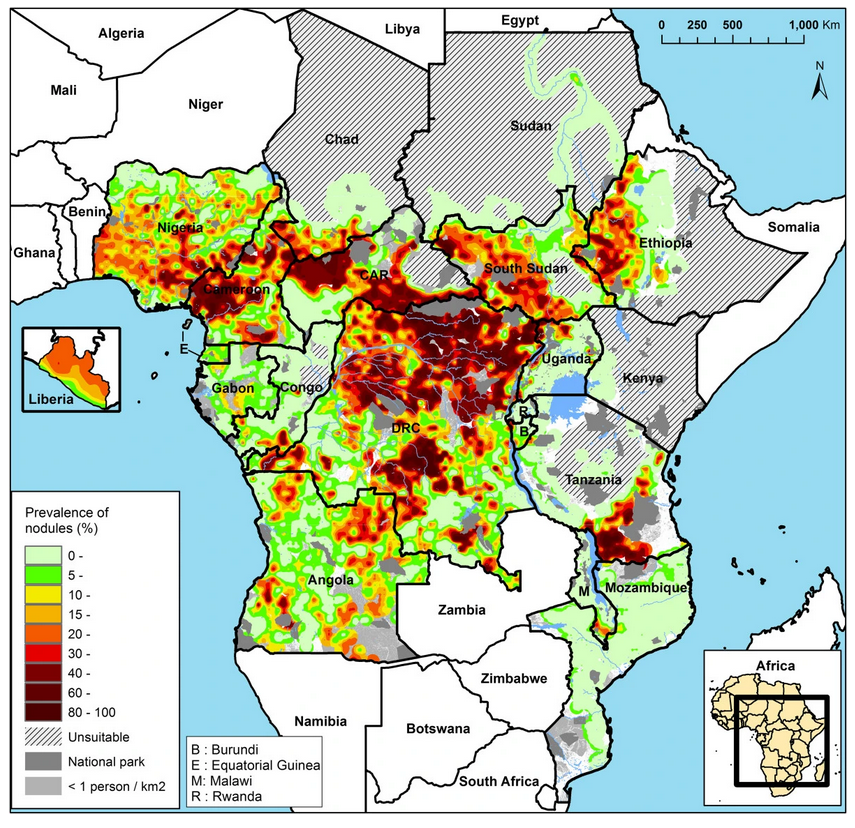
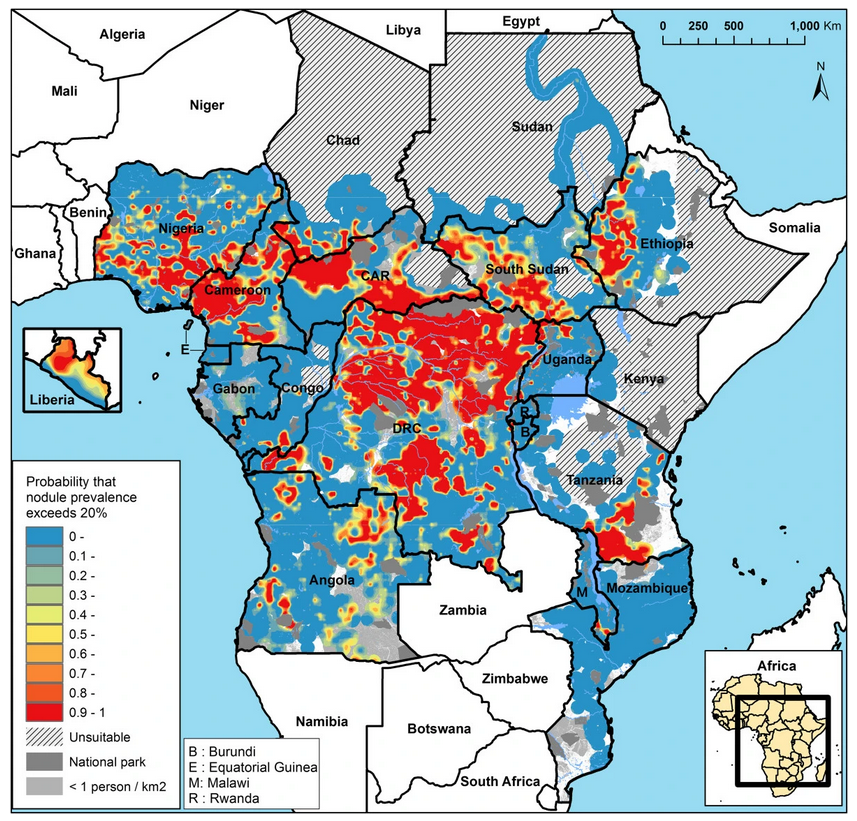
Mapping river-blindness
PrevMap and RiskMap
Giorgi, E. and Fronterre, C. (expected August 2025) Model-based geostatistics for global public health using R. Chapman and Hall/CRC. The R Series.
Identifying disease hotspots
- Hotspot: riverblindness prevalence above \(20\%\)
- Exceedance probability: \({\rm Prob}\{p(x) > 0.2 \: | \: Y \}\)
Extensions to spatio-temporal modelling
Question: Which spatio-temporal correlation structures are suitable for modelling disease prevalence data?
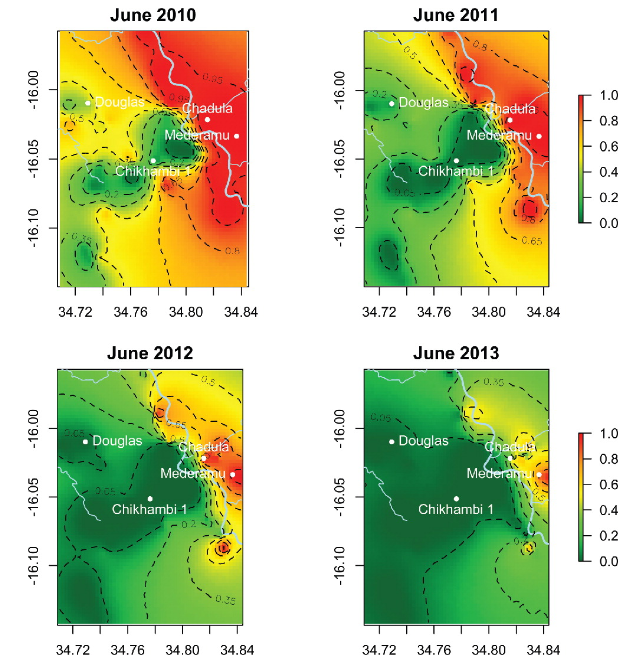
Giorgi, E., Diggle, P. J., Snow, R. W., Noor, A. M. (2018). Geostatistical methods for disease mapping and visualization using data from spatio-temporally referenced prevalence surveys. International Statistical Review. https://doi.org/10.1111/insr.12268
Combining data from multiple diagnostics
Questions: 1) How we predict a gold-standard diagnostic using cheap biased diagnostics? 2) How do we model the bivariate relationship between two complementary gold-standards?
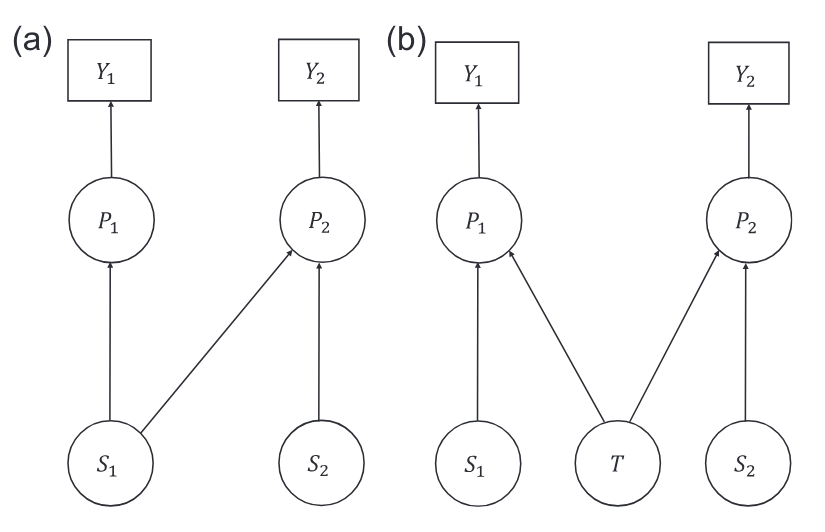
Amoah, B., Diggle, P. J., Giorgi, E. (2019). A geostatistical framework for combining data from multiple diagnostic tests. Biometrics. doi:10.1111/biom.13142
Spatially structured zero-inflation
Question: How can we effectively model the bivariate relationship between disease suitability and disease prevalence?
Diggle, P. J., Giorgi, E. (2016). Model-based geostatistics for prevalence mapping in low-resource settings (with discussion). Journal of the American Statistical Association. 111:1096-1120
Translation into policy: the case of trachoma
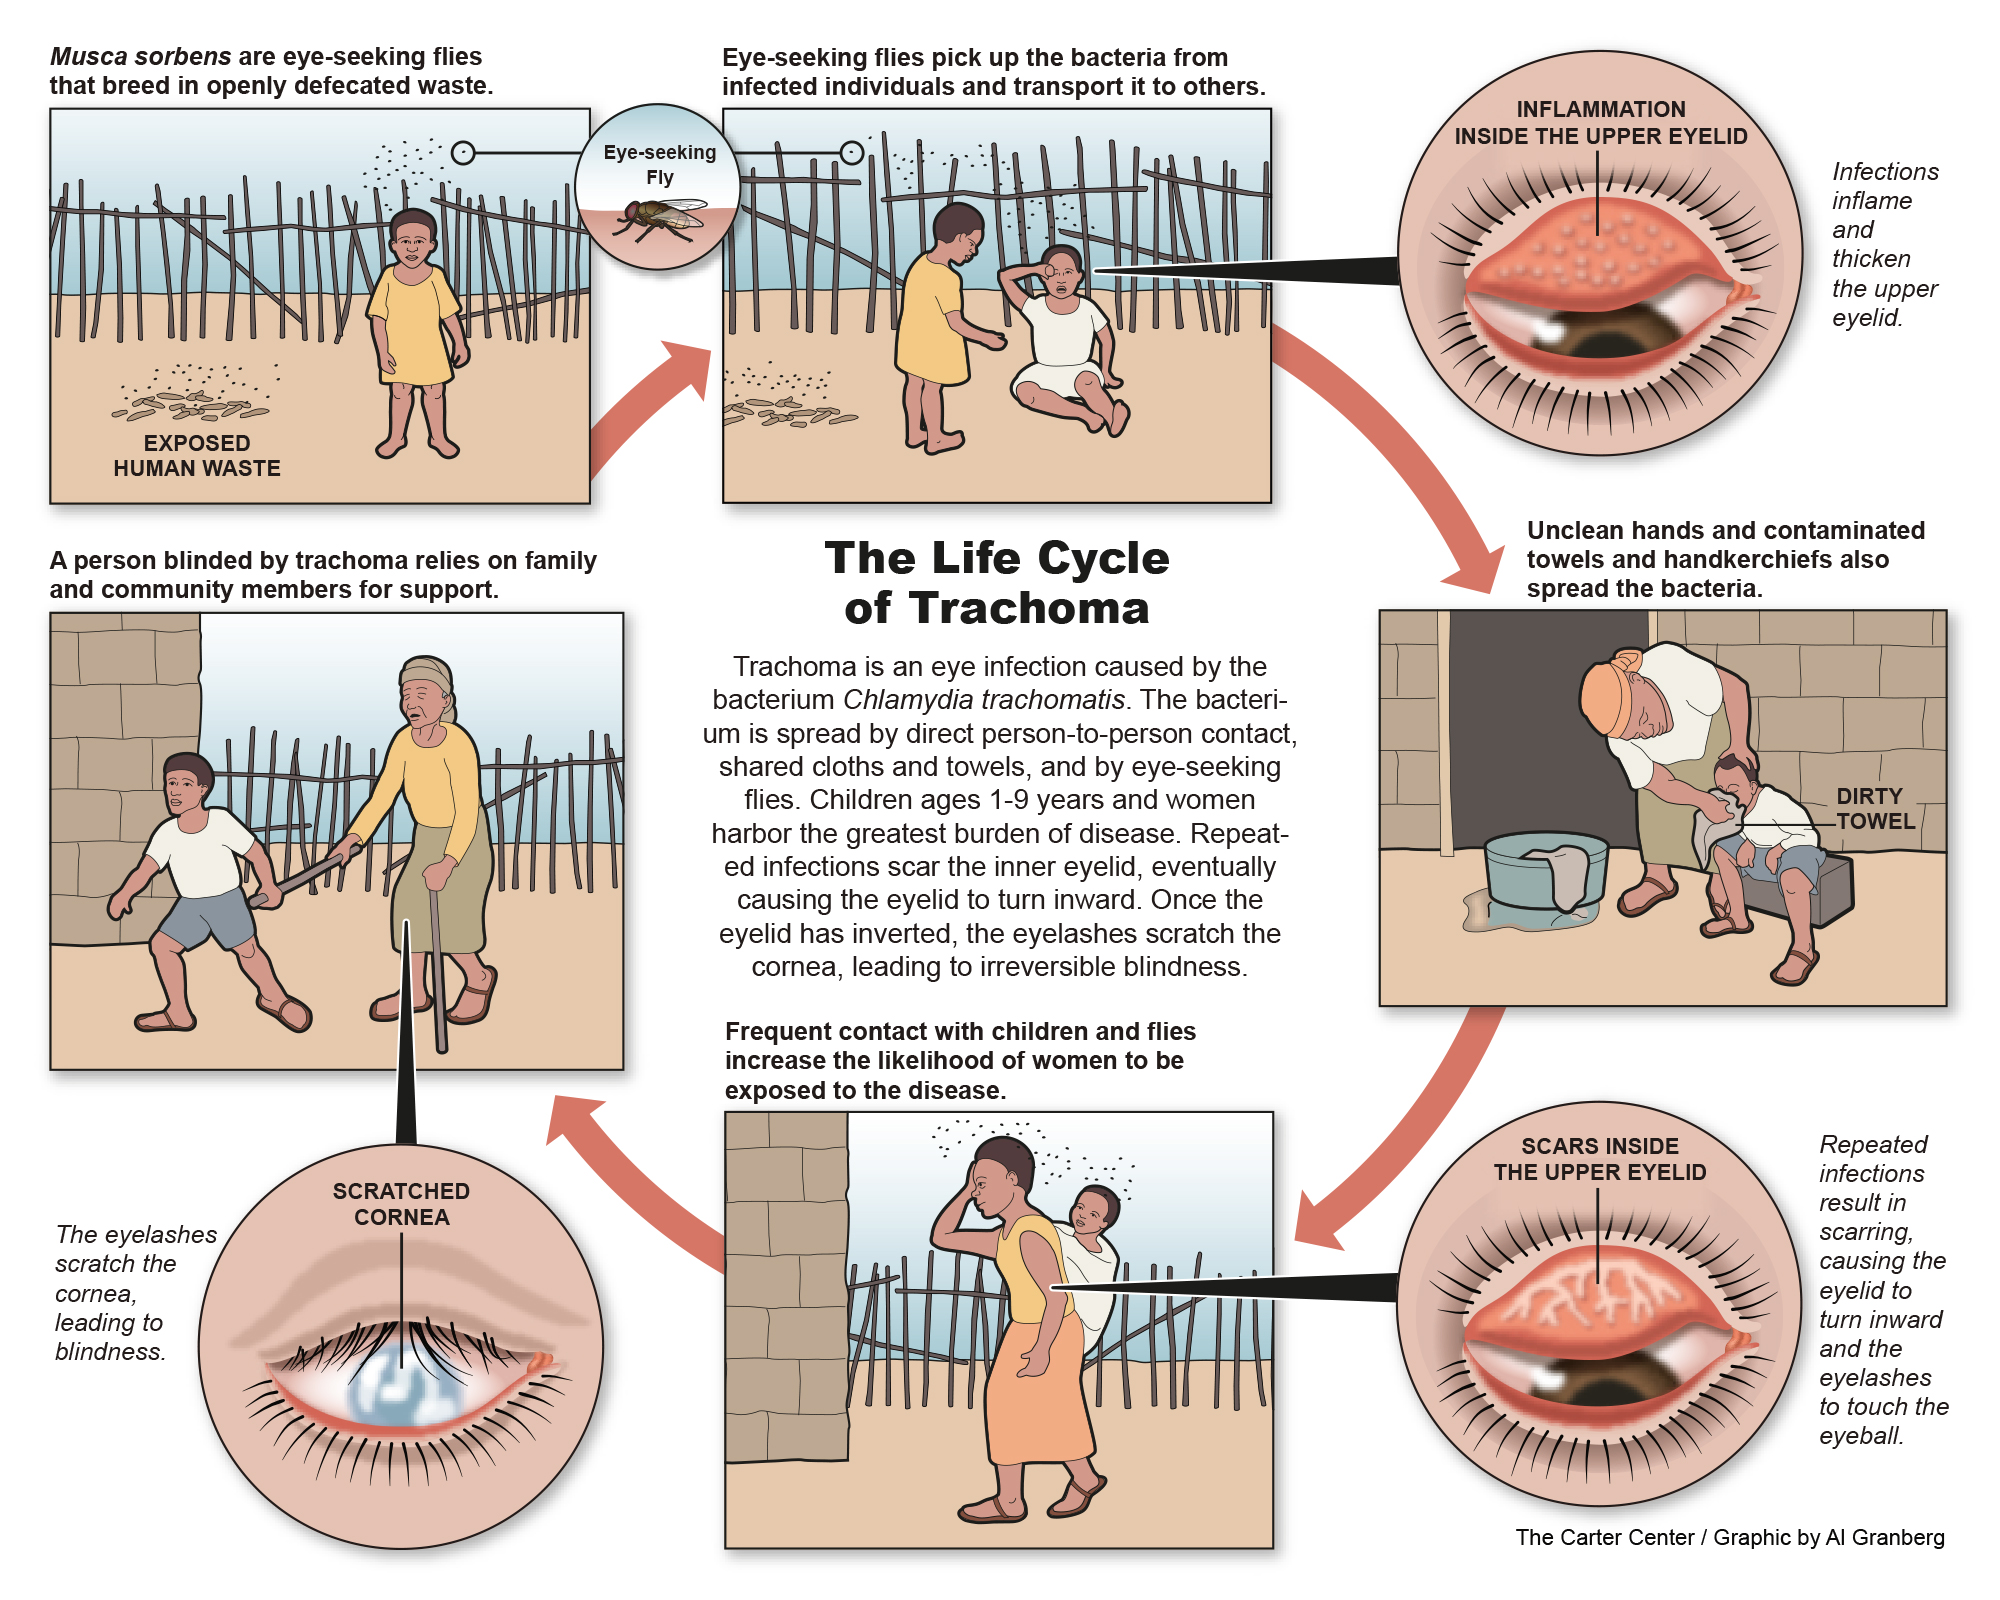
Informing the elimination of trachoma
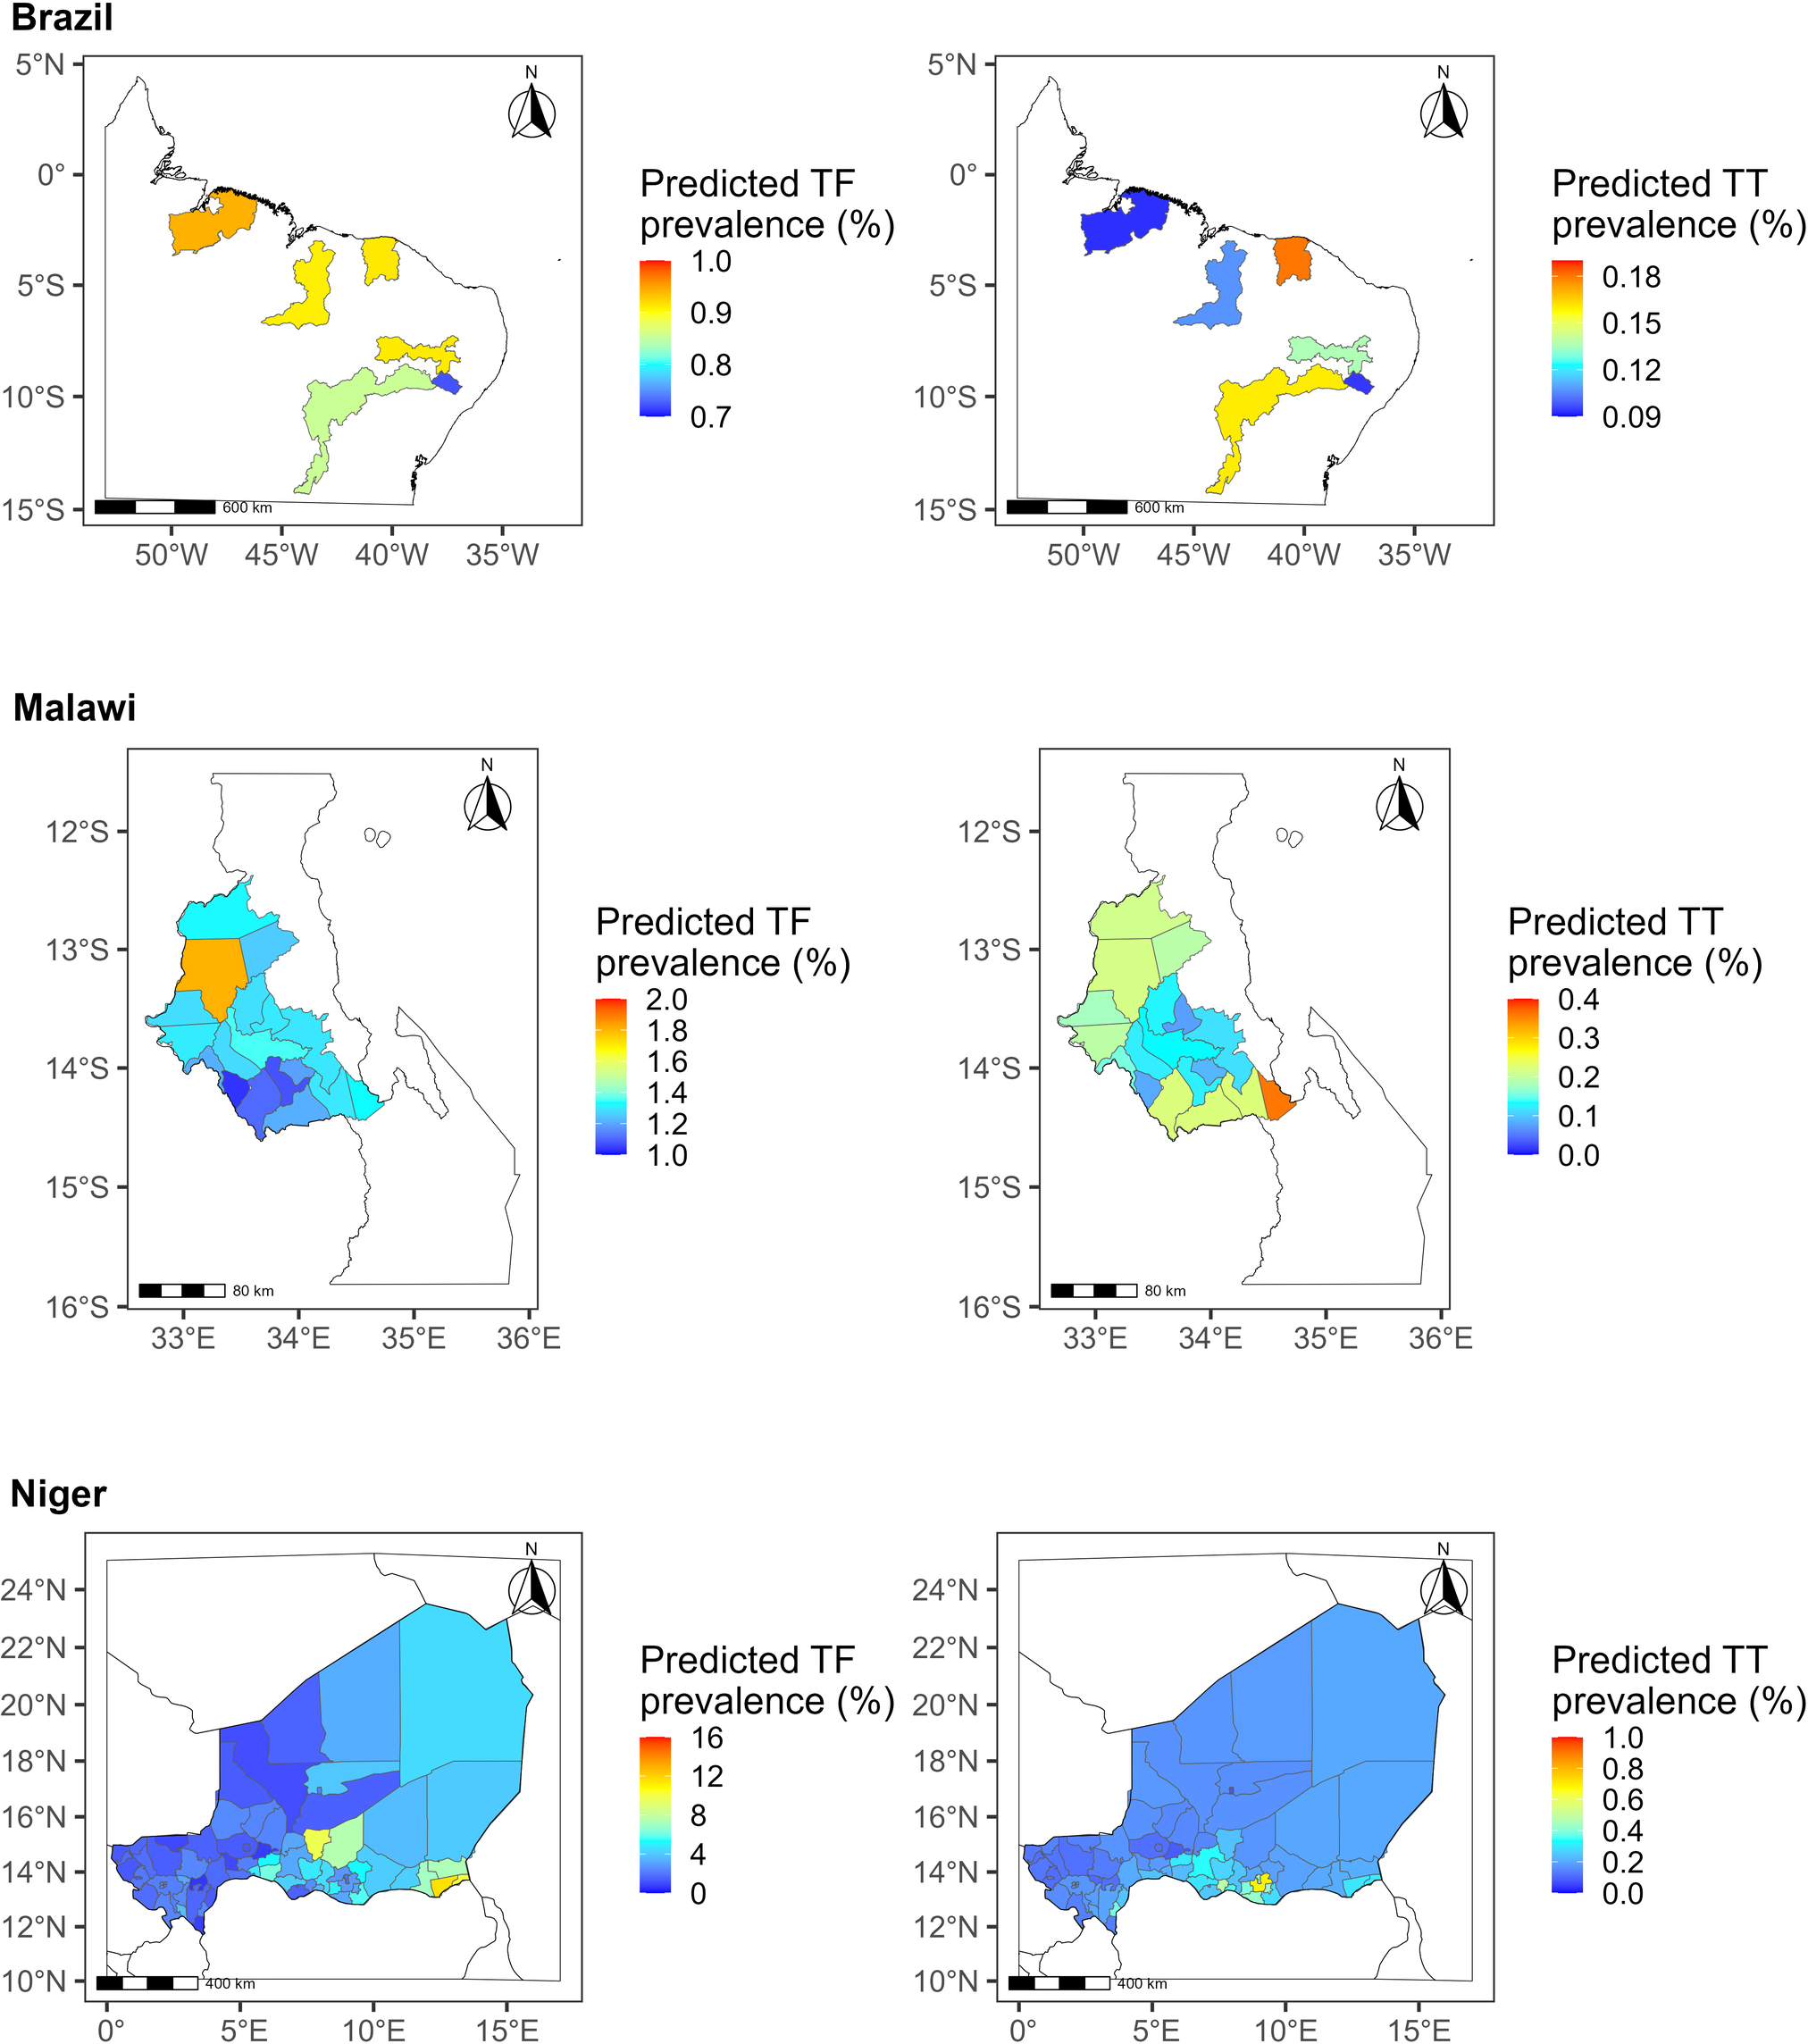
Sasanami, M., et al. (2023). Using model-based geostatistics for assessing the elimination of trachoma. PLoS Neglected Tropical Diseases, 17(7): e0011476. https://doi.org/10.1371/journal.pntd.0011476
Engagement with policy makers
Technical meeting on geostatistical methods for trachoma elimination
Lancaster University, 4-5 March 2024
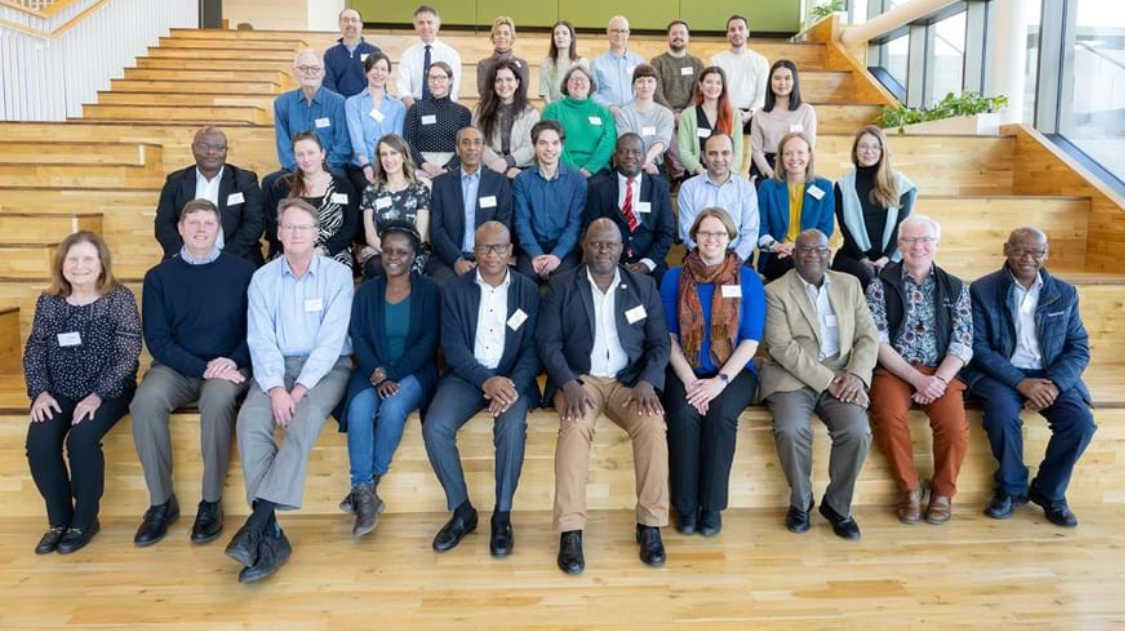
Engagement with policy makers
Technical meeting on capacity building
Lancaster University, 3-4 March 2025
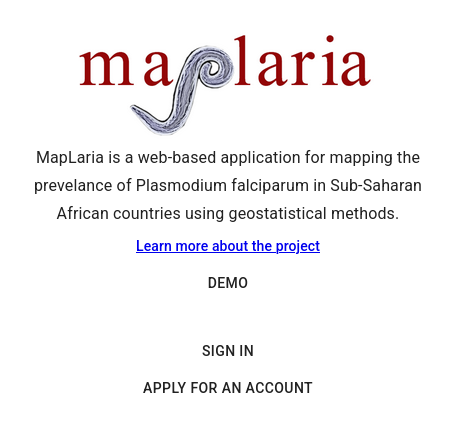
A user-friendly app for malaria mapping
THANK YOU!

Let’s Connect
🔗 giorgistat.github.io
📧 e.giorgi@bham.ac.uk
📍Department of Health Sciences, University of Birmingham, Birmingham, UK